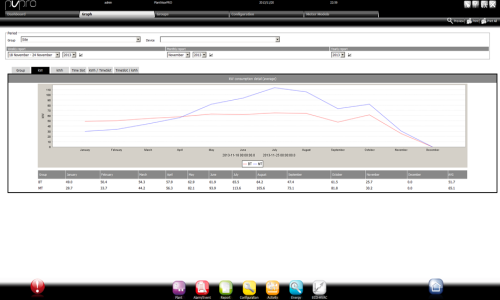
Consumption statistics and time trends can be viewed for a given period in the Graph page.
The available values are at the plant, group or single meter levels:
Current year consumption or previous year consumption, with monthly details.
Monthly consumption in the current year, with daily details.
Weekly consumption in the current year with daily details.
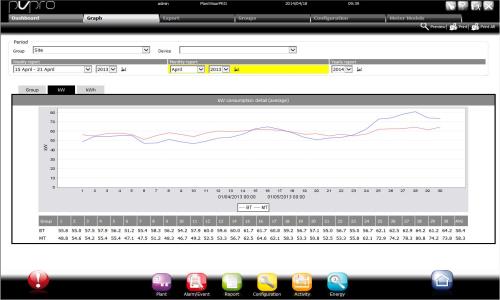
![]() Analyzing consumption: fixed cost settings
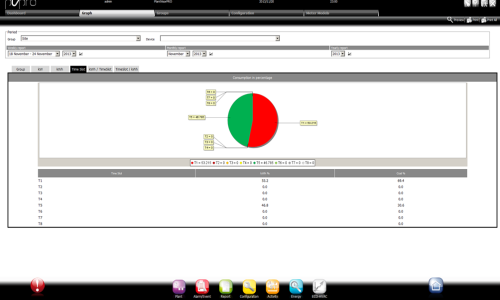
Analyzing consumption: fixed cost settings
Three graphs are displayed on the page if Fixed cost settings are used:
the percent consumption, power, energy, costs and corresponding CO2
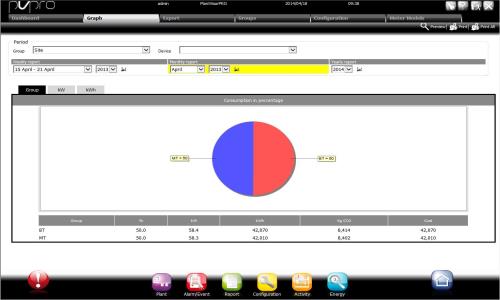
details of consumption average in kW
details of consumption in kWh
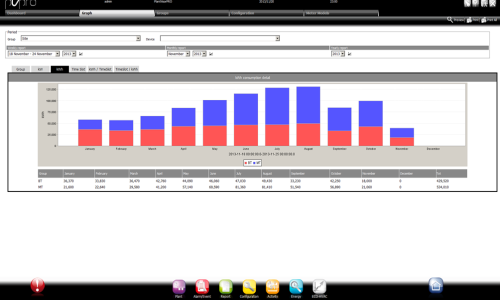
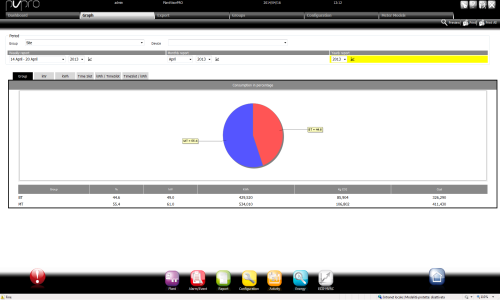
![]() Analyzing consumption: setting up time slots
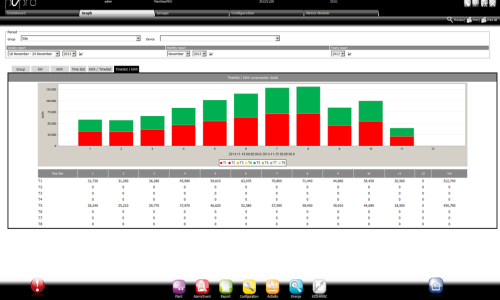
Analyzing consumption: setting up time slots
Six graphs are displayed on the page if Time Slot settings are used:
the percent consumption, power, energy, costs and corresponding CO2
details of consumption average in kW
details of consumption in kWh
percent consumption and costs for each cost category
total consumption and costs for each cost category
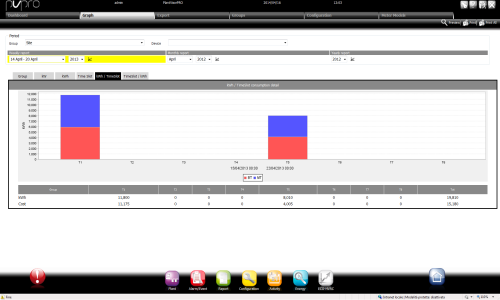
total consumption for each cost category with daily details (weekly and monthly report) or monthly details (annual report)
![]() Viewing graphs and setting up reports
Viewing graphs and setting up reports
Select the site, group or single meter.
Select the period.
Click ![]() .
.
![]() Enlarging or printing graphs
Enlarging or printing graphs
Pie and line graphs can be enlarged and printed.
Click ![]() to enlarge the graph
to enlarge the graph
Click ![]() to print the displayed graph or all graphs.
to print the displayed graph or all graphs.
![]() See also
See also
-
PlantVisorPRO Locale 2.2.0 -