In the Main page, click ![]() :
:
the first duty cycle is calculated for each showcase
If the Smooth lines algorithm is enabled, the first sample is taken to check the status of each showcase
After having started the plugin the trend of the set point on each rack can be checked by reading the graph on the main page. Main.
Enabled racks appear in the page with an indication of the control algorithm:Floating suction or Smooth lines.
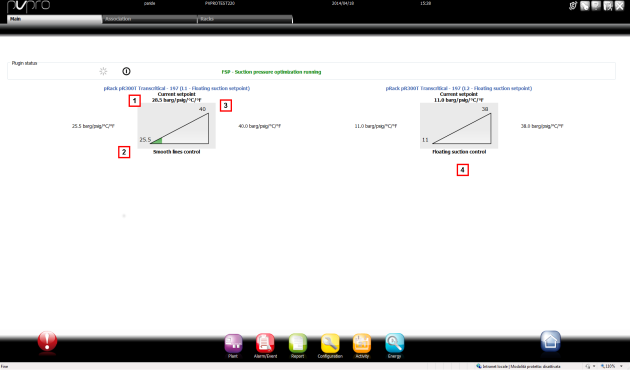
| Area | Description |
|---|---|
|
1 |
Current set point: current rack set point variable value. The graph is not colored if equal to the minimum value. |
|
2 |
Minimum set point: minimum value available for the Set Point variable on the rack |
|
3 |
Maximum set point: maximum value available for the Set Point variable on the rack |
|
4 |
Running algorithm indication. |
![]() See also
See also
Floating suction: introduction
Floating Suction: algorithm parameters
Floating Suction: customizing parameters
PlantVisorPRO Locale 2.2.0 -