Open topic with navigation
PlantVisor PRO basic concepts > Graphs: basic concepts
HACCP and log graphs: basic concepts
Basic concepts
PlantVisorPRO Locale graphs can display recorded log variable curves:
Graph and curve aspects
For each device the system automatically assigns a standard graph aspect and curve color and minimum and maximum limits to each variable. The purpose of limits is to display the curve and its trend, for example, to eliminate insignificant values. If the variable takes values out of the set range, the curve is not displayed (see paragraph Off line device or out of range values)
The graph and curve aspects can be customized on two different levels:
|

|
Graphs set on the device level can be propagated to other identical devices.
Graphs can be set on all levels (device, group and global) by a user with a certain profile, it can be propagated to users in other profiles (see chapter Setup propagation).
|
Graph preparation
A graph that groups variables to be compared can be dynamically constructed during monitoring on different levels (global, group, device).
The created graph can be printed and kept until the next change.
Graph features
Graphs represent:
-
Analog, Integer and Boolean variables from different devices
-
values samples in different periods
-
values with different range limits
Graphs are therefore powerful service analysis tools for Service technicians.
Off line device or value out of range.
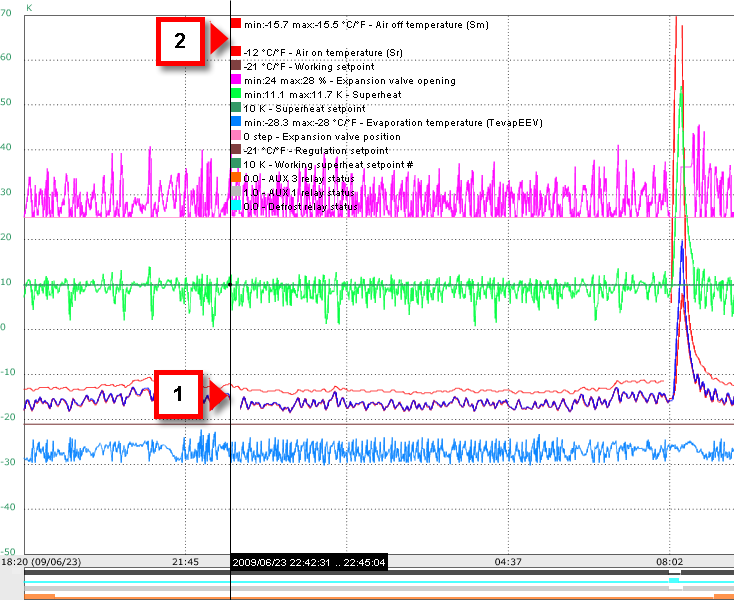
A failed reading or value out of range causes a "gap" in the curve [1] and is indicated by a missing sample value in the key [2].
|
|
Failed data reading due to a device fault is always signaled by an alarm.
|
 See also
Graph setup procedure
Setting up graphs
Displaying a HACCP or log report
PlantVisorPRO Locale 2.2.0 -
+030220771 Manual ver. 2.3 dated May, 9th 2014 - © 2007-2014 CAREL