Installer help file (setup) > Eco HVAC > HVAC Smart Start > Graph

HVAC Smart Start: graph

Path:

, HVAC Smart Start, Graph page


Purpose

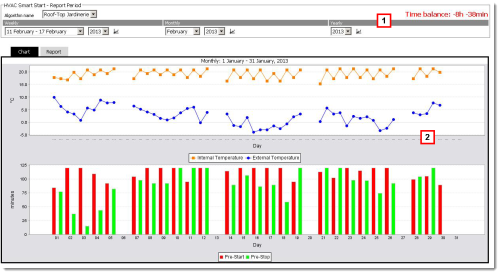
This page display HVAC Smart Start log trends on a weekly, monthly or yearly basis.

Description

-

What to do first

Set operations. See the Settings page.

Page description

Page area descriptions

Area Description

1

Area where the HVAC Smart Start activity period to be graphically displayed in area 2 can be selected:

  • Weekly: display based on a week divided into days and with real-time values
  • Monthly: display based on a month divided into days and with real-time values
  • Yearly: display based on a year divided into weeks with average values

2

Graphic display of selected period trends in area 1:

  • Report tab: data regarding: minutes on before building opening, indoor and outdoor temperature when climate control system was turned on, minutes on after the building closed, indoor and outdoor temperature when the climate control system was turned off.
  • Graph tab: dual mode graph displaying °C (indoor and outdoor temperature logged on each day when the climate control system was turned on and off) and Minutes (minutes the climate control system was on before the building opened and after it closed)

Action

Other actions

-

See also

PlantVisorPRO Locale 2.2.0 - +030220771 Manual ver. 2.3 dated May, 9th 2014 - © 2007-2014 CAREL