Path:![]()
 , Smart Night Purge, Graph page
|
Path: |
|
|
|
|
|
Purpose |
This page display Smart Night Purge log trends on a weekly, monthly or yearly basis. |
|
Description |
- |
|
What to do first |
Set operations. See the Settings page. |
Page description
Page area descriptions
| Area | Description |
|---|---|
|
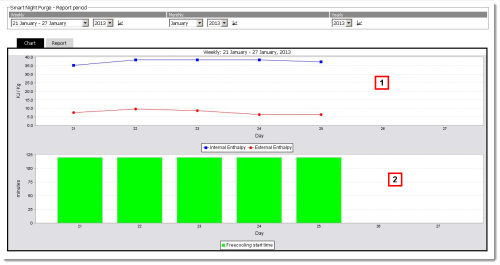
1 |
Area where the Smart Night Purge activity period to be graphically displayed in area 2 can be selected: • Weekly: display based on a week divided into days and with real-time values • Monthly: display based on a month divided into days and with real-time values • Yearly: display based on a year divided into weeks with average values |
|
2 |
Graphic display of the selected period Smart Night Purge trend in area 1: • Report tab: data on the length of free cooling and indoor/outdoor temperature, humidity and enthalpy. Data is displayed as weekly averages in the yearly report. • Graph tab: graphic representation in dual KJ/kg mode (indoor and outdoor enthalpy trend) and Minutes (free cooling length in minutes). |
![]() Action
Action
 to update
![]() Other actions
Other actions
-
![]() See also
See also
Smart Night Purge: introduction
PlantVisorPRO Locale 2.2.0 -